What is RNAprotDB?
RNAprotDB is a web interface for the dynamic exploration of protein-RNA interfaces and pairs of homologous protein-RNA interfaces, called interologs. It was developped by Mahmoudi et al.
This work was supported by a grant from Agence Nationale de la Recherche (ANR) as part of the ESPRINet project (ANR-18-CE45-0005).
Construction of RNAprotDB
Dataset
We created a dataset of protein-RNA interface structures from the Protein Data Bank [1]. We extracted binary protein-RNA interfaces from structures of relevant biological assemblies and we retained structures determined by X-ray crystallography or cryo-electron microscopy with a resolution better than 2.5 Å, where the protein contains at least 30 amino acids, and the RNA at least 10 nucleotides. We defined interface residues as those with inter-chain minimum heavy-atom distance smaller than 5 Å. Only interfaces with at least 5 amino acids and 5 nucleotides were kept. When a protein amino acid was in contact with nucleotides from two different RNA chains that were base-paired, the two RNA chains were merged to form a single protein-RNA interface. We then clustered protein chains (respectively, RNA chains) at sequence identity 100% (respectively, 99%) and we obtained a subset of representative interfaces. These interfaces were structurally aligned [2] all-against-all and compared to identify pairs of interfaces with similar binding modes. We thus identified 2,022 pairs of homologous interfaces among 765 protein-RNA interfaces. RNAprotDB enables the interactive structural visualization of these interfaces and pairs of homologous interfaces.
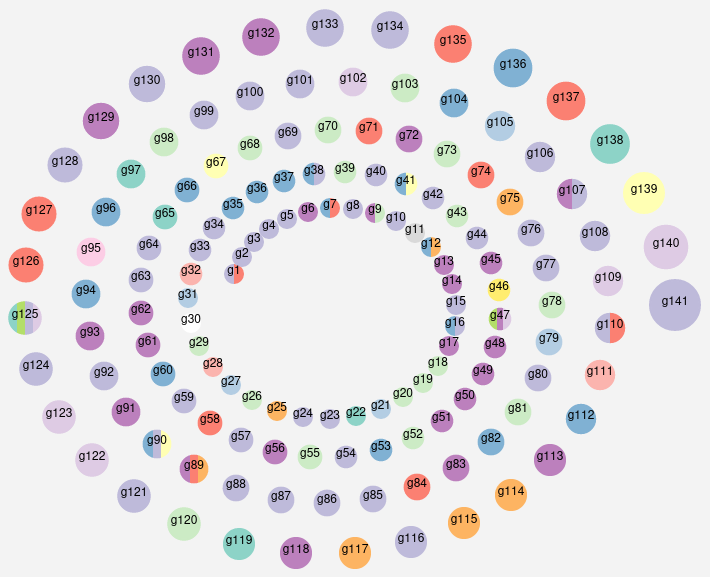
We defined graphs where each of the 765 interfaces is a node and each pair of structural interologs is an edge. We formed groups of interologs, defined as the connected components of this graph by networkx [3]. We obtained 141 groups containing between 2 and 29 interfaces. RNAprotDB also enables the visualization of these groups and their graph architectures.
Protein-RNA interface annotation
We annotated protein-RNA interfaces based on:
Comparison between interologs
When comparing two interologs, we use the metrics returned by TM-align, RNA-align and MM-align in terms of TM-score. We also use the MM-align structural alignment to recompute the protein/RNA coverage (overlap between the two proteins/RNAs), the interface RMSD and the interface sequence identity (defined as the minimum between the protein sequence identity and the RNA sequence identity at the interface).
We assess which amino acid-nucleotide contacts are conserved between the two interfaces. This comparison is based on the structural alignment between the two interfaces, and does not depend on the type of amino acid/nucleotide. We compute a percentage of contact conservation, where each amino acid/nucleotide contact is weighted by the number of pairs of atoms within 5 Å distance. We compute a similar percentage for apolar contacts (C atoms only) and for hydrogen bonds and salt bridges.
We also consider whether non-conserved contacts are due to the amino acid and/or the nucleotide no longer belonging to the interface in the interolog, a phenomenon we term “switching out” of the interface. We assess the percentage of non-conserved contacts due to switching out for each pair of interologs.
Levels of exploration
RNAprotDB can be explored at different levels. Users can also download relevant information as tables in each view, for either the full datasets or a given interface or pair of interologs.
Interolog groups

The home page provides an overall view of the 141 interolog groups. Nodes are colored by ECOD architecture level information from the common ECOD domains in each group. Nodes can be clicked to explore each group. Users can search for specific keywords within PDB, ECOD and Rfam descriptions of the macromolecular components, to allow for the extraction of biologically relevant information from our data.
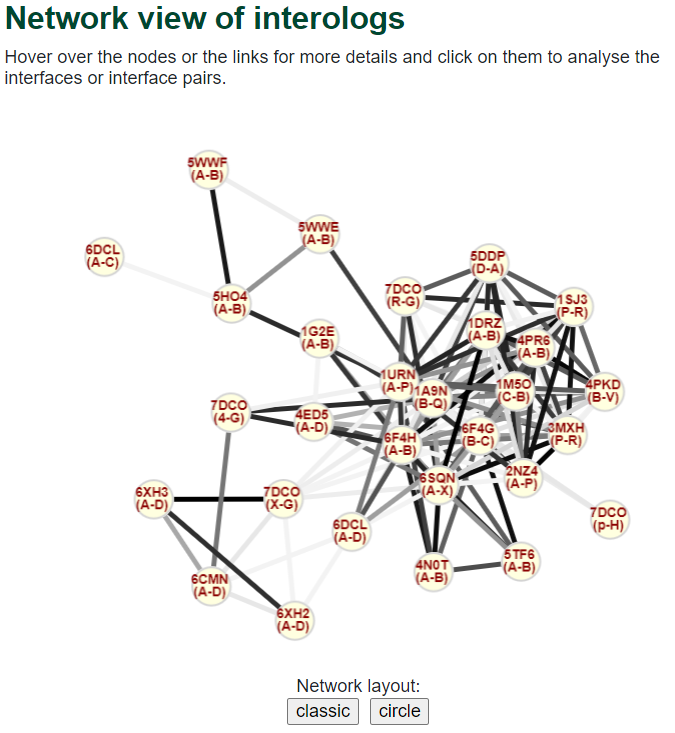
Network view for a group of interologs

In this view, network nodes are interfaces and edges are homology relationships between interfaces; edge colors reflect interface sequence identity (gray color scale - the darker, the higher the identity). Some details about the interolog pairs in this group are also displayed in a table view. Nodes can be reorganized according to predefined layouts (classic or circle) or dragged manually. Nodes can be clicked to go to a single interface 3D structural view. Edges can be clicked to go to interface comparison 3D structural view.
3D structural visualization of a single interface

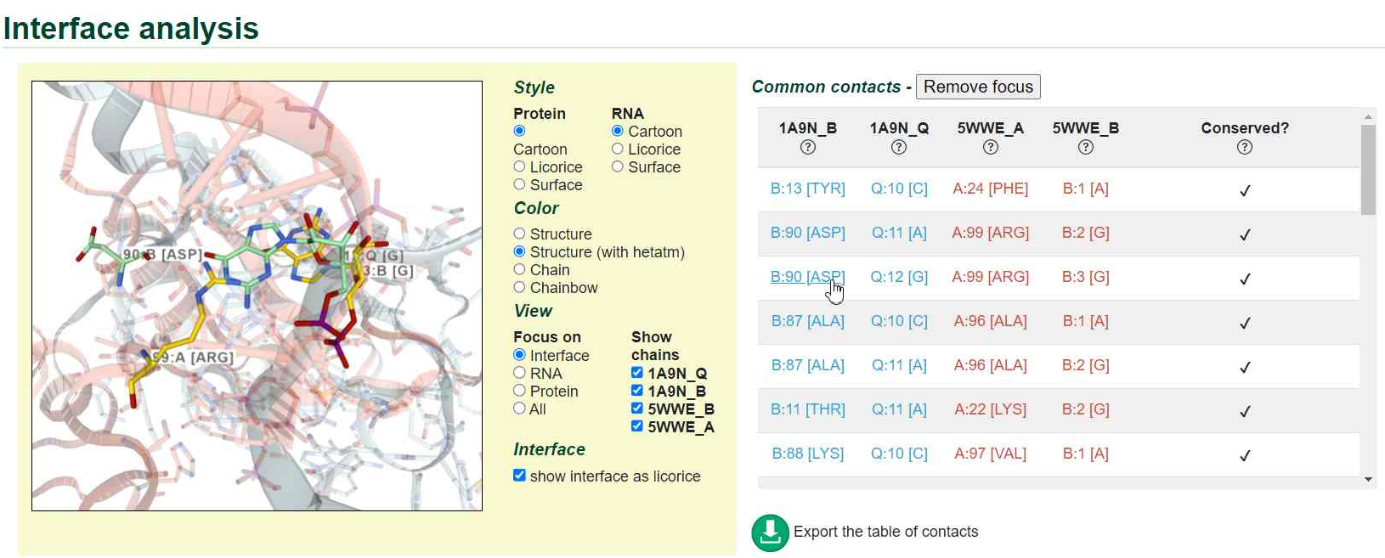
This view allows for the exploration of the 3D structure of an interface. In the interactive 3D view, various modes of representation can be chosen for each chain (cartoon, licorice or surface, with chain, heteratom or chainbow coloring). The protein chain can be colored according to hydrophobicity, electrostatics, accessibility (core and rim regions) and evolutionary conservation computed with the Rate4Site program [6]. In parallel, a list of amino acid-nucleotide contacts in this interface is displayed and each interface position can be clicked to display its environment in the 3D view (neighboring positions and contacts). At the bottom of the interface page, some interface properties are displayed, as well as the list of interologs for this interface.
3D structural comparison of two homologous interfaces

In the case of a pair of interologs, we display information about the conserved and non-conserved contacts and the aligned interface structures can also be explored interactively. The interactive 3D view behaves similarly to the 3D view of single interfaces: contacts in the list can be clicked to display the aligned amino acid/nucleotide pairs. At the bottom of the interface page, we display the properties of the interolog pair, as well as other pairs of interologs involving one of the two interfaces.
Table of all interfaces
This recaps all 765 interfaces in our dataset. Users can search for specific keywords within PDB, ECOD and Rfam descriptions of the macromolecular components, as well as the PDB and Uniprot identifiers, to allow for the extraction of biologically relevant information from our data.
References
To cite our work
Structural analysis of protein-RNA interface evolution
Ikram Mahmoudi, Chloé Quignot, Carla Martins, Jessica Andreani
Université Paris-Saclay, CEA, CNRS, Institute for Integrative Biology of the Cell (I2BC), 91198, Gif-sur-Yvette, France
DOI: 10.1371/journal.pcbi.1012650
Contact email: jessica.andreani@cea.fr (JA)
Tools used for dataset construction
-
PDB: Burley SK, Bhikadiya C, Bi C, Bittrich S, Chao H, Chen L, et al. RCSB Protein Data Bank (RCSB.org): delivery of experimentally-determined PDB structures alongside one million computed structure models of proteins from artificial intelligence/machine learning. Nucleic Acids Res 2023;51:D488–508.
doi: 10.1093/nar/gkac1077 -
MM-align: Mukherjee S, Zhang Y. MM-align: a quick algorithm for aligning multiple-chain protein complex structures using iterative dynamic programming. Nucleic Acids Res 2009;37:e83.
doi: 10.1093/nar/gkp318 -
Networkx: Hagberg AA, Schult DA, Swart PJ. Exploring Network Structure, Dynamics, and Function using NetworkX 2008.
https://github.com/networkx/networkx -
ECOD: Cheng H, Liao Y, Schaeffer RD, Grishin NV. Manual classification strategies in the ECOD database: ECOD Manual Classification Strategies. Proteins Struct Funct Bioinforma 2015;83:1238–51.
doi: 10.1002/prot.24818 -
Rfam: Kalvari I, Nawrocki EP, Ontiveros-Palacios N, Argasinska J, Lamkiewicz K, Marz M, et al. Rfam 14: expanded coverage of metagenomic, viral and microRNA families. Nucleic Acids Res 2021;49:D192–200.
doi: 10.1093/nar/gkaa1047 -
Rate4Site: Pupko T, Bell RE, Mayrose I, Glaser F, Ben-Tal N. Rate4Site: an algorithmic tool for the identification of functional regions in proteins by surface mapping of evolutionary determinants within their homologues. Bioinformatics 2002;18 Suppl 1:S71-7.
doi: 10.1093/bioinformatics/18.suppl_1.s71
Tools used for the webserver
This site was generated using Django and django modules. Networks were plotted using Cytoscape and tooltips on the network were created using the jquery and qtip. Protein-RNA interface structures are displayed in three-dimensions using the WebGL-based NGL Viewer plugin. Many thanks also to the RPBS platform and their NGL Viewer code from which we inspired ourselves to create the protein-rna interface visualisations in NGL Viewer.
-
Django v4.1.6 [Computer Software]. (2023).
https://www.djangoproject.com/ -
Bootstrap v4.1.3
Github. https://github.com/twbs/bootstrap -
Franz M, Lopes CT, Huck G, Dong Y, Sumer O and Bader GD.
Cytoscape.js: a graph theory library for visualisation and analysis.
Bioinformatics (2016) 32 (2): 309-311.
doi: 10.1093/bioinformatics/btv557 -
jQuery v3.7.1
Github. https://github.com/jquery/jquery -
qTip2 v2.2.0
Github. https://github.com/qTip2/qTip2 -
Max Franz, Manfred Cheung, nicky1038, Alexander Li, Alex Quatrano, & Nowell Strite. (2019).
cytoscape/cytoscape.js-qtip 2.8.0 (2.8.0).
Zenodo. https://doi.org/10.5281/zenodo.3516277 -
AS Rose, AR Bradley, Y Valasatava, JM Duarte, A Prlić and PW Rose.
Web-based molecular graphics for large complexes.
ACM Proceedings of the 21st International Conference on Web3D Technology, 2016.
doi: 10.1145/2945292.2945324 -
AS Rose and PW Hildebrand.
NGL Viewer: a web application for molecular visualization.
Nucl Acids Res, 2015.
doi: 10.1093/nar/gkv402


