What is RNAProtCI?
RNAprotCI (RNA-protein Core Interaction) is a database of protein-RNA interactions integrating structural and RNA binding motif data. It provides a dynamic visualisation of the interface structures and binding motifs, as well as pre-computed agreement scores between both information sources.
It was developed by Fauconnet et al.
This work was supported by Agence Nationale de la Recherche (ANR, grants ANR-18-CE45-0005 ESPRINet, ANR-22-CE44-0044 DeepTransfo and ANR-24-CE35-2173 CDefenseRNA).
Construction of RNAprotCI
Firstly, structural data were extracted from the Protein Data Bank (PDB) [1] and structures were filtered to remove peptides (<50 amino acids) and small interaction interfaces (less than 2 interface nucleotides and/or less than 5 interface amino acids). Pre-processed RNA binding motif data were extracted from Kuret et al [2]. These data were filtered to keep cases with at least RNA compete (RNAC) or RNA Bind-n-Seq (RBNS) motif data, then matched with structural data based on UniProt protein annotations and BLAST sequence similarity search. Finally, agreement scoring between structural and omics protein-RNA interaction data was assessed via a PWM score (see "Agreement scoring" below).
Protein-RNA interface annotation
We annotated protein-RNA interfaces based on:
Agreement scoring
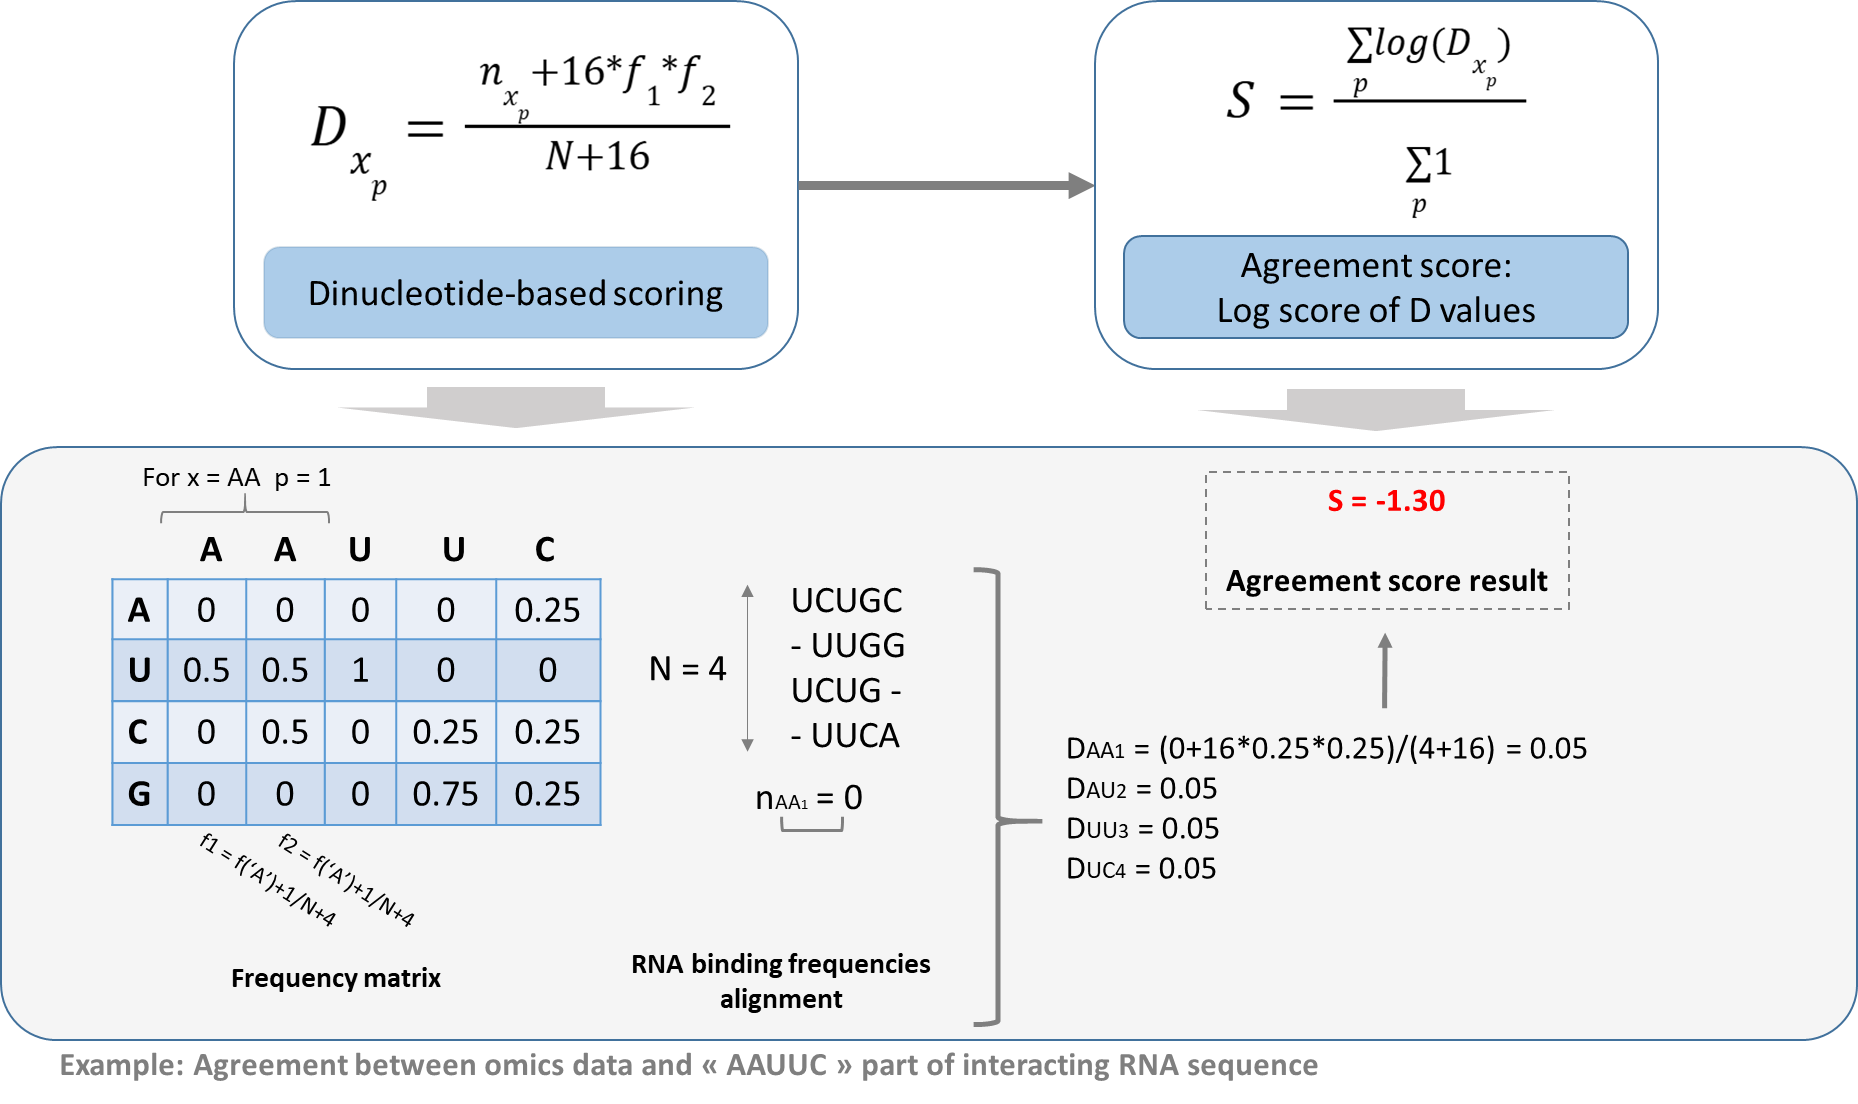
The agreement score 𝑆, inspired from a transcription factor binding site predictor using position weight matrices (Siddharthan [5]), is computed by aligning the frequency matrix (from RNA binding frequencies) to subparts of the interacting RNA sequence (from the protein-RNA interaction structure) using an iterative sliding window strategy. We use dinucleotide-based scoring to better capture binding preferences. Each element 𝐷 is defined as the likelihood to observe the dinucleotide 𝑥 at position 𝑝 in the RNA sequence subpart with respect to the frequency matrix and 5-mer alignment. At a given dinucleotide position 𝑝, 𝑛𝑥𝑝 represents the number of observed dinucleotides 𝑥 in the RNA binding frequency alignment and 𝑛 represents the total number of dinucleotides at this position. A pseudocount is added to manage dinucleotides with few occurrences: 𝑓1 and 𝑓2 represent normalized frequencies of both nucleotides in 𝑥 in the aligned frequency matrix, and there are 16 possible dinucleotides. This score is applied to all dinucleotides at all positions in the RNA sequence and averaged to simplify comparisons between proteins.
Navigating the database
List of all proteins studied in this database
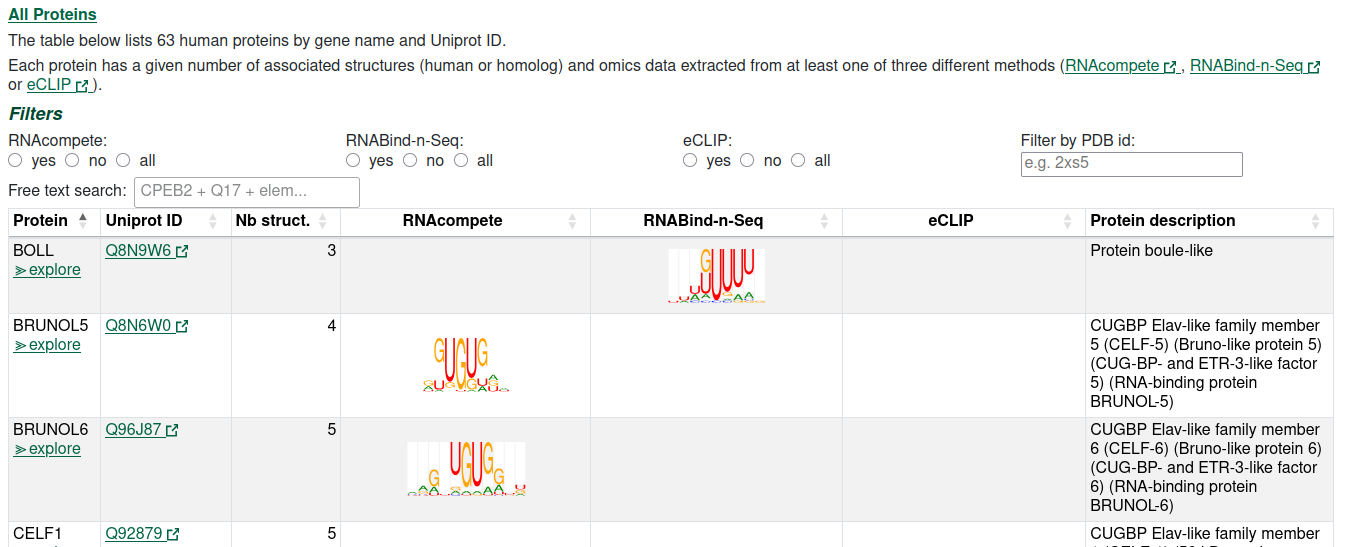
This page provides an overview of all 63 proteins for which we were able to associate protein-RNA interaction structures and RNA binding motif data for at least RNAC or RBNS. Users can search for specific keywords within the Uniprot ID (ex: P35637), protein name (ex: FUS) or description fields, or filter to select proteins with specific RNA binding motif experiment data (RNAC, RBNS and/or CLIP) displayed as WebLogos [6]. Users can additionnaly, filter by PDB id using the dedicated search field. The “explore” button directs to the table of associated structures and related information, while clicking on the UniProt ID redirects to the corresponding Uniprot database entry [7].
List of all structures of a given protein in the PDB
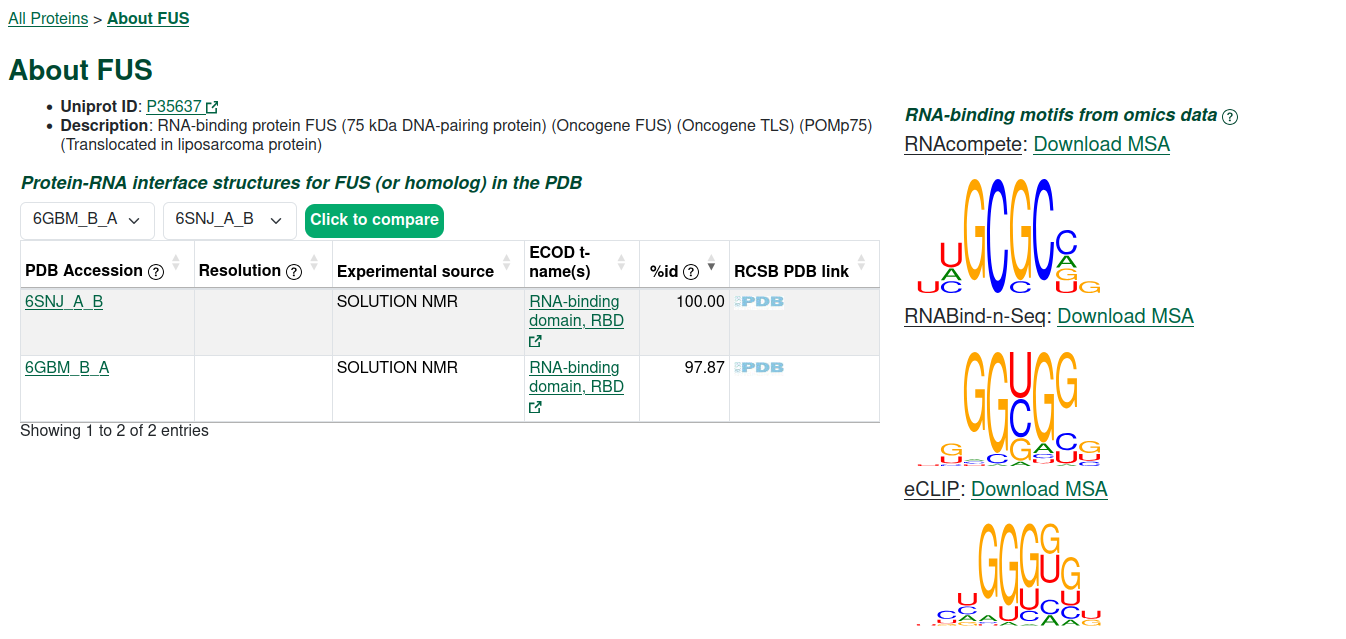
This particular focus on a given protein lists all related protein-RNA structures that have associated RNA binding motif data. The PDB accession is composed of the PDB identifier, the protein chain and RNA chain (PDBid_protchain_RNAchain). Users can click on it to reach the 3D visualisation web interface. The %id represents the percentage of sequence identity between the protein sequence in the PDB structure and the Uniprot protein sequence. The right panel allows users to download the RNA binding motif alignment used to create the WebLogo, for available data sources. Above the table, two dropdown menus allow the user to pick a pair of PDB accessions in order to structurally align them.
Single structure: Visualisation of {PDBid_protchain_RNAchain}
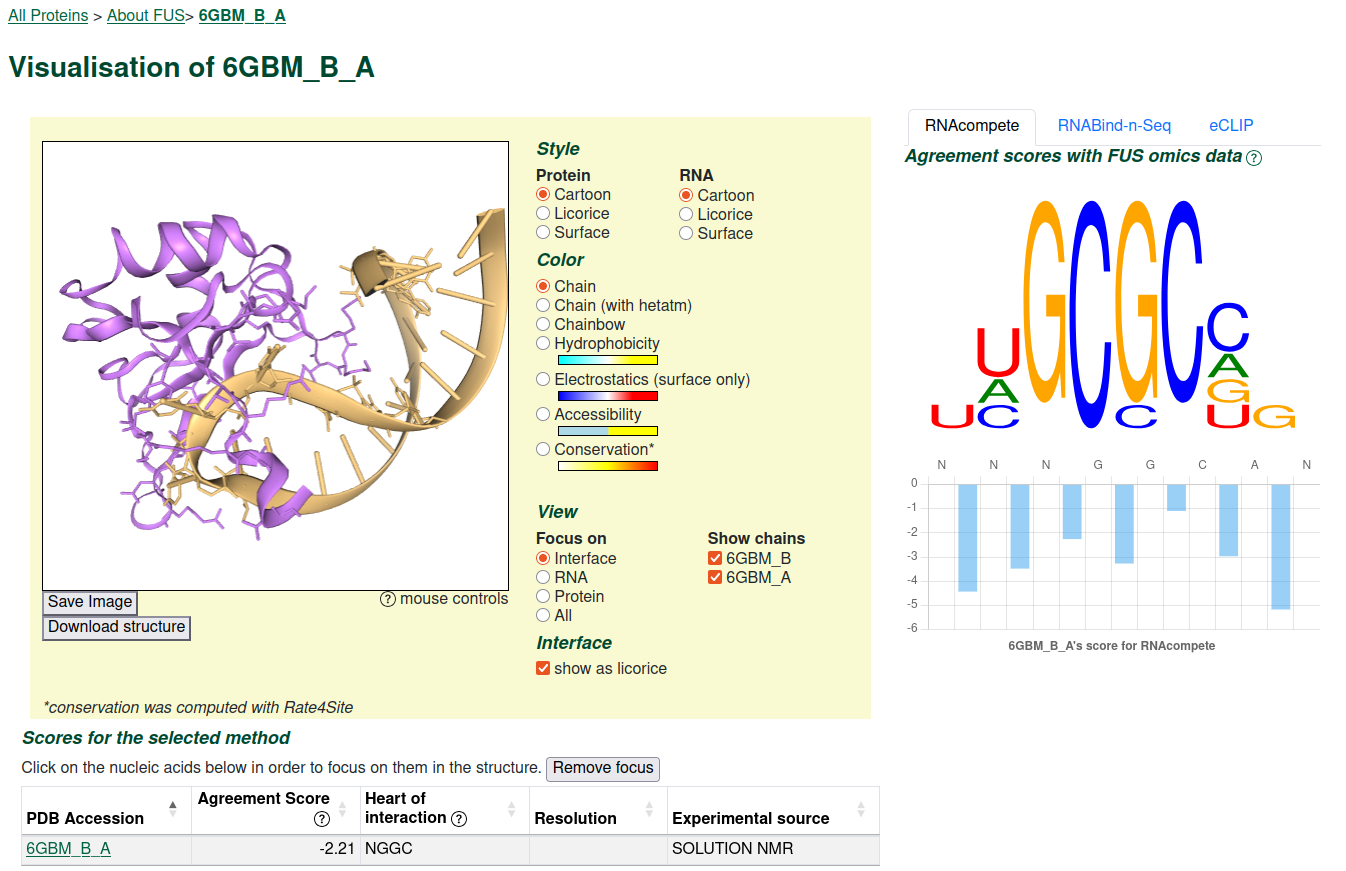
The top left panel allows for the exploration of the 3D structure of an interface.
In the interactive 3D view, various modes of representation can be chosen for each chain
(cartoon, licorice or surface, with chain, heteroatom or chainbow coloring). The protein
chain can be colored according to hydrophobicity, electrostatics, accessibility (core and
rim regions) and evolutionary conservation computed with the Rate4Site program [8].
The bottom left panel provides the agreement score and the 4 nucleotides that fit the best
with the selected RNA binding motif data source. Clicking on these nucleotides highlights
them in the interactive 3D view.
On the right side, users can choose the RNA binding motif data source they want to focus on and
the motif logo is shown. Below the motif logo, the best-fitting part of the structural interacting
RNA is shown with associated dinucleotide scores as a histogram. Higher scores (close to 0)
represent the best agreement scores.
Aligned structures
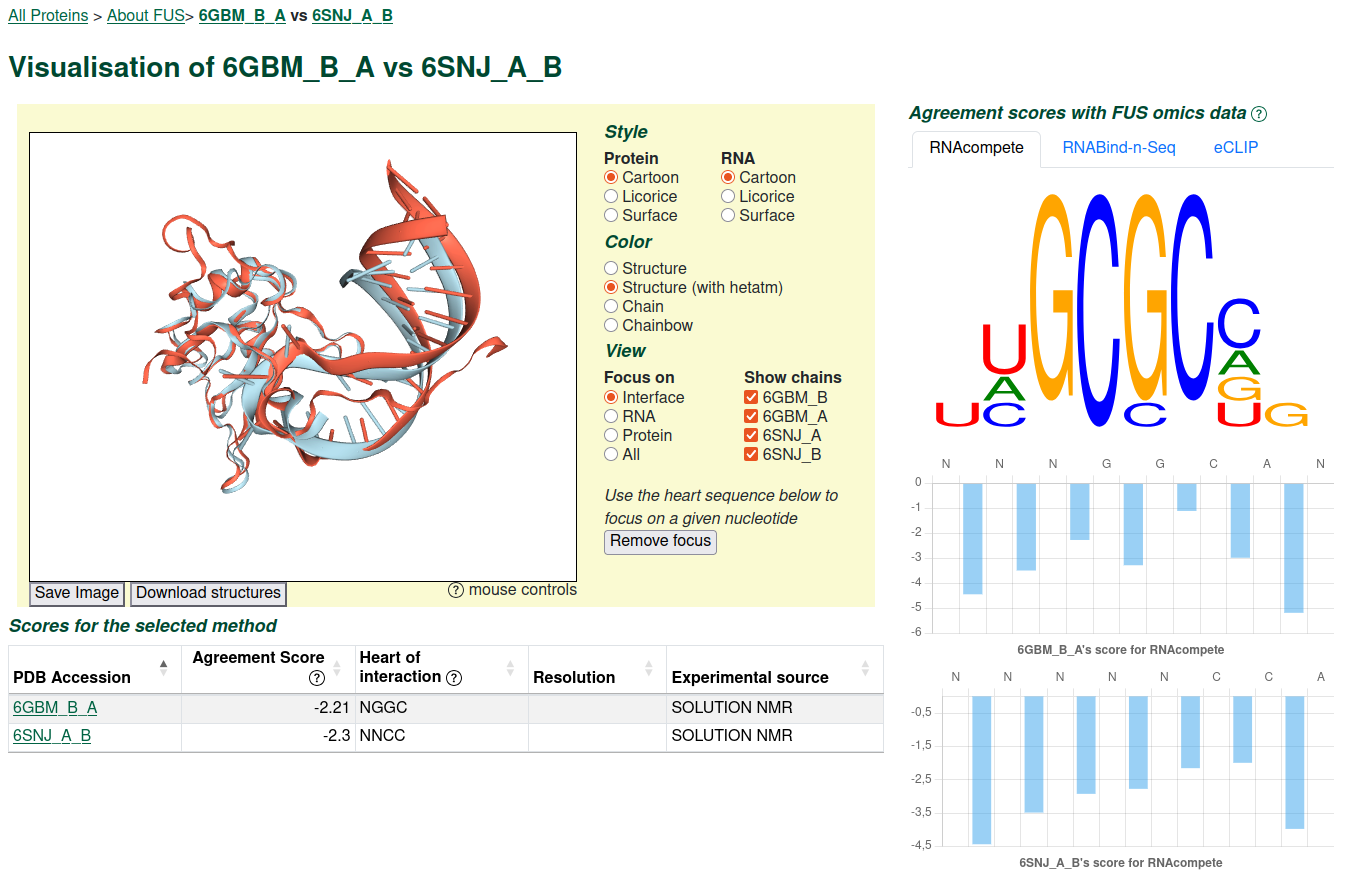
In the case of a pair of interfaces, the aligned interface structures can also be explored interactively.
The interactive 3D view behaves similarly to the 3D view of single interfaces.
In this section, structures are aligned together using US-align [9]. Agreement scores
are represented for both protein-RNA interactions with two histograms.
References
This work: please cite Fauconnet et al. 2025Tools used for dataset construction
- [1] PDB: Burley SK, Bhikadiya C, Bi C, Bittrich S, Chao H, Chen L, et al.
RCSB Protein Data Bank (RCSB.org): delivery of experimentally-determined PDB structures alongside one million computed structure models of proteins from artificial intelligence/machine learning.
Nucleic Acids Res 2023;51:D488–508.
doi: 10.1093/nar/gkac1077 - [2] Kuret et al: Kuret K, Amalietti AG, Jones DM, Capitanchik C, Ule J.
Positional motif analysis reveals the extent of specificity of protein-RNA interactions observed by CLIP.
Genome Biol [Internet]. 2022 Sept 9;23(1).
doi: 10.1186/s13059-022-02755-2 - [3] ECOD: Cheng H, Liao Y, Schaeffer RD, Grishin NV.
Manual classification strategies in the ECOD database: ECOD Manual Classification Strategies.
Proteins Struct Funct Bioinforma 2015;83:1238–51.
doi: 10.1002/prot.24818 - [4] Rfam: Kalvari I, Nawrocki EP, Ontiveros-Palacios N, Argasinska J, Lamkiewicz K, Marz M, et al.
Rfam 14: expanded coverage of metagenomic, viral and microRNA families.
Nucleic Acids Res 2021;49:D192–200.
doi: 10.1093/nar/gkaa1047 - [5] Siddharthan: Siddharthan R.
Dinucleotide Weight Matrices for Predicting Transcription Factor Binding Sites: Generalizing the Position Weight Matrix.
Khanin R, editor. PLoS ONE. 2010 Mar 22;5(3):e9722.
doi: 10.1371/journal.pone.0009722 - [6] WebLogo: Crooks GE, Hon G, Chandonia J-M, Brenner SE.
WebLogo: A Sequence Logo Generator:
Genome Res 2004;14:1188–90.
doi: 10.1101/gr.849004 - [7] Uniprot: The UniProt Consortium.
UniProt: the Universal Protein Knowledgebase in 2025.
Nucleic Acids Res. 53:D609–D617 (2025).
doi: 10.1093/nar/gkae1010 - [8] Rate4Site: Pupko T, Bell RE, Mayrose I, Glaser F, Ben-Tal N.
Rate4Site: an algorithmic tool for the identification of functional regions in proteins by surface mapping of evolutionary determinants within their homologues.
Bioinformatics 2002;18 Suppl 1:S71-7.
doi: 10.1093/bioinformatics/18.suppl_1.s71 - [9] US-Align: Zhang C, Freddolino L, Zhang Y.
A graphic and command line protocol for quick and accurate comparisons of protein and nucleic acid structures with US-align.
Nat Protoc 2025.
doi: 10.1038/s41596-025-01189-x
Tools used for the webserver
This site was generated using Django and django modules. Tables are displayed using Ajax Datatables and histogrammes are plotted thanks to Chartjs. Protein-RNA interface structures are displayed in three-dimensions using the WebGL-based NGL Viewer plugin. Many thanks also to the RPBS facility and their NGL Viewer code from which we inspired ourselves to create the protein-rna interface visualisations in NGL Viewer.
- Django v4.2.22 [Computer Software]. (2025).
https://www.djangoproject.com/ - Bootstrap v5.25.1
Github. https://github.com/twbs/bootstrap - Franz M, Lopes CT, Huck G, Dong Y, Sumer O and Bader GD.
Cytoscape.js: a graph theory library for visualisation and analysis.
Bioinformatics (2016) 32 (2): 309-311.
doi: 10.1093/bioinformatics/btv557 - jQuery v3.7.0
Github. https://github.com/jquery/jquery - AS Rose, AR Bradley, Y Valasatava, JM Duarte, A Prlić and PW Rose.
Web-based molecular graphics for large complexes.
ACM Proceedings of the 21st International Conference on Web3D Technology, 2016.
doi: 10.1145/2945292.2945324 - AS Rose and PW Hildebrand.
NGL Viewer: a web application for molecular visualization.
Nucl Acids Res, 2015.
doi: 10.1093/nar/gkv402 - ChartJS v4
Github. https://github.com/chartjs/Chart.js - DataTables v2.1.7 [Computer Software]. (2025).
https://datatables.net/
Contact information
For help or to report a problem, please email us at jessica.andreani@i2bc.paris-saclay.fr (principal coordinator) and/or contact-bioi2@i2bc.paris-saclay.fr (BIOI2 bioinformatics facility).