Learning how to manipulate and visualise protein structures

Demo Step 5: Model validation with ChimeraX
As you will have noticed, there are 2 models of rank 1 in the data you’ve downloaded: one is relaxed, the other is unrelaxed (default output of AlphaFold). In this step, we’ll be comparing both of these structures in terms of clashes and distortion.
Detect clashes
Clashes are atoms that are too close to each other. In real life, clashes cannot exist.
Of note, clashes might not always need removing, depending on the downstream application you have of your model.
You can calculate clashes:
![]() graphically through the Menu bar in Tools > Structure Analysis > Clashes (/!\ make sure you only have one model active)
graphically through the Menu bar in Tools > Structure Analysis > Clashes (/!\ make sure you only have one model active)
Here, you can play around with the parameters or leave the default values. In the “Treatment of results” section, there are parameters that will enable you to customise the output display (if clashes are shown like contacts between the involved atoms, if atoms that clash should be explicitly shown using a different style visualisation, the name of the clash object that will appear in the Models pane, …).
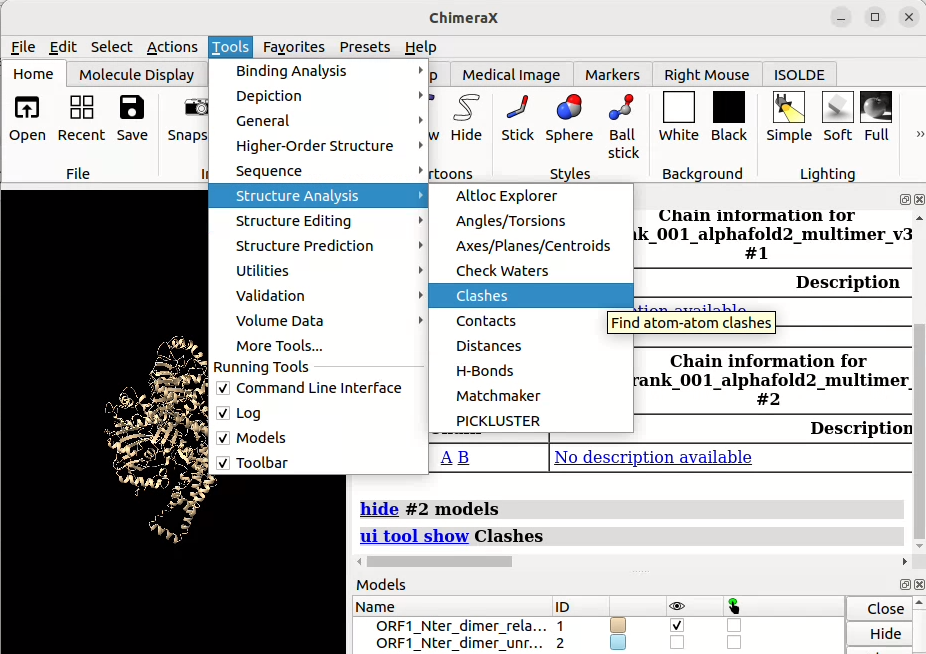
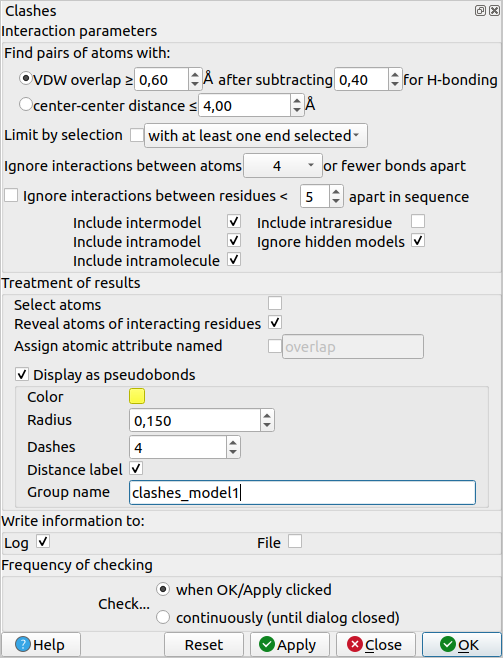
To delete the clashes object, you can just select it in the Models pane (make sure to only select the objects you want to clear) and click on “Close”.
![]() in-line with the clashes command, for example:
in-line with the clashes command, for example:
clashes #1 showDist true color lime reveal true log true
will run the clash detection on model #1. The rest of the command specifies a few extra parameters with their values. Setting showDist to “true” for example will plot the distances onto the structure as dotted lines.
To delete a clashes object, you can use clashes delete name <object name> (replace <object name> by the name of your object).
![]() Click here for detailed information on the clashes command line options.
Click here for detailed information on the clashes command line options.
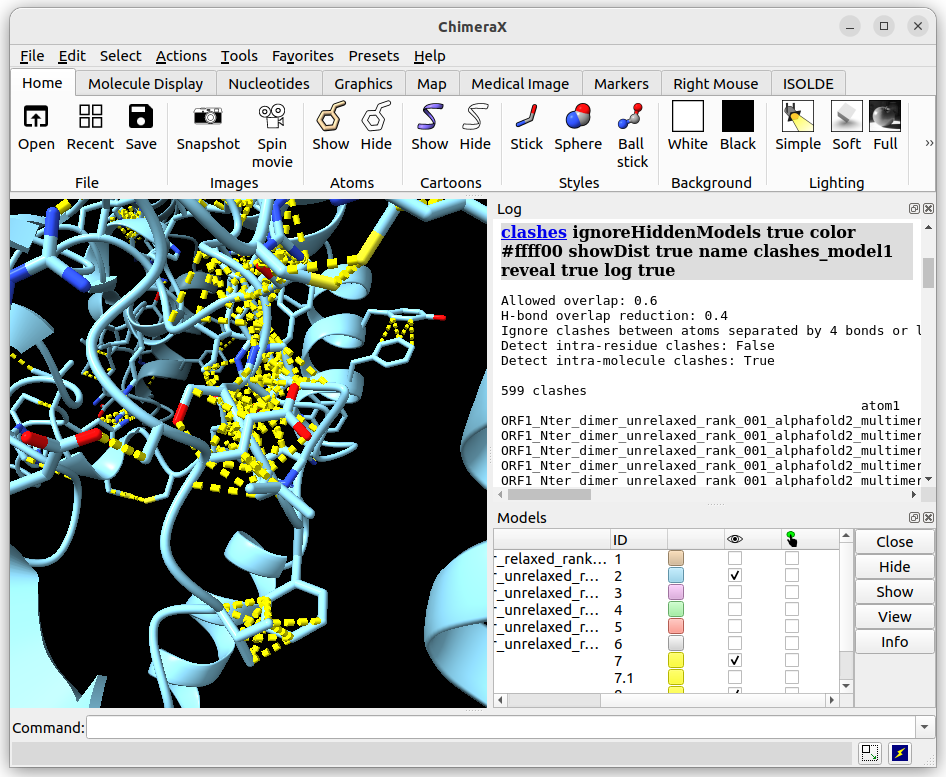
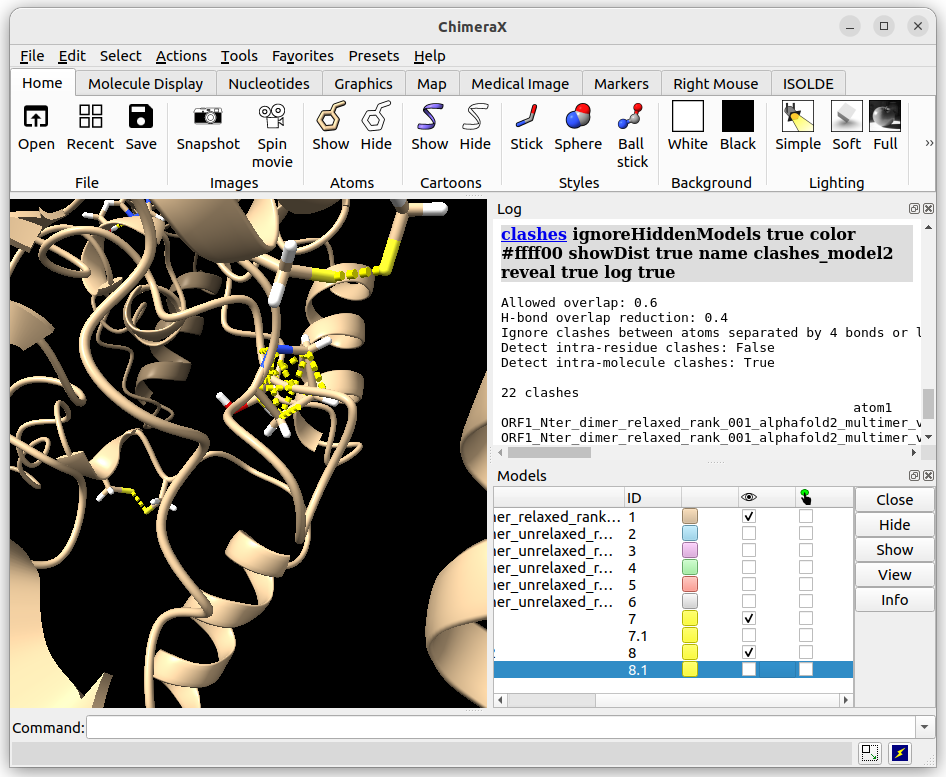
Now if we calculate the clashes for both models (unrelaxed and relaxed), we can see that the unrelaxed has 599 clashes detected whilst the relaxed model only has 22:
Unrelaxed structure
Relaxed structure
Visualise backbone distortions with Ramachandran maps
Ramachandran maps summarise visually the distribution of two important backbone angles of consecutive residues: φ and ψ. Since atoms don’t like to overlap with each other, only some combinations of φ and ψ are possible, of which only a small proportion are actually favourable. In a Ramachandran map, each dot is a residue of your structure and its φ and ψ angles are its x- and y-axis coordinates. Dots that are outside of the favorable zones on the plot are residues with unfavorable φ and ψ angles i.e. their backbones are severely strained.
You can plot Ramachandran maps:
![]() graphically through the Menu bar in Tools > Validation > Ramachandran Plot
graphically through the Menu bar in Tools > Validation > Ramachandran Plot
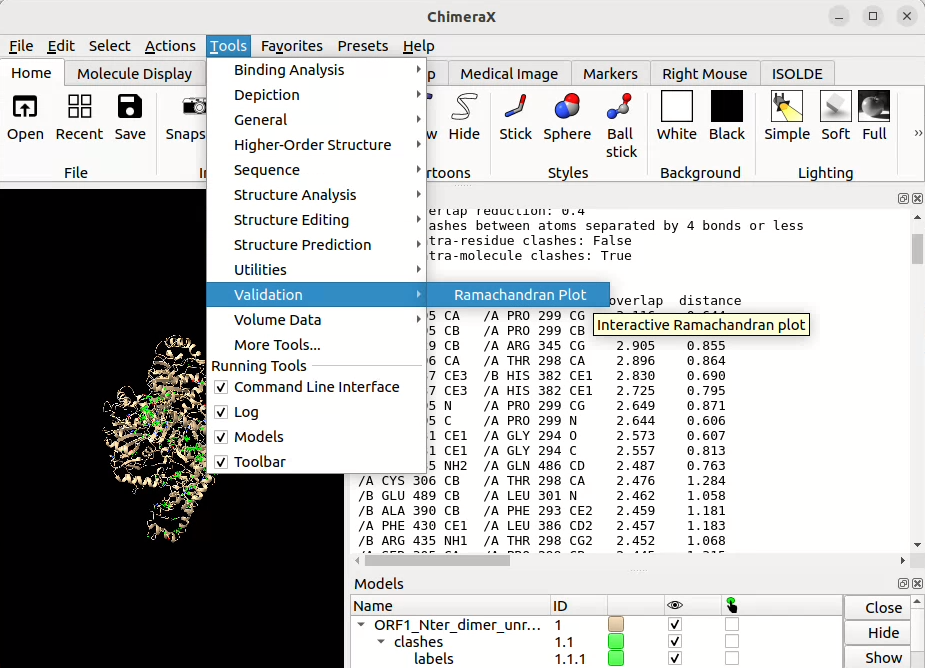
![]() plotting Ramachandran maps through the command line doesn’t seem to be possible (yet) with ISOLDE…
plotting Ramachandran maps through the command line doesn’t seem to be possible (yet) with ISOLDE…
![]() Click here for detailed information on the Ramachandran plot in ISOLDE.
Click here for detailed information on the Ramachandran plot in ISOLDE.
Now if we calculate the Ramachandran plots for both models (unrelaxed and relaxed), we see dots of different colour over a grey-scale background: grey zones correspond to favourable or acceptable zones in the map, each dot represents a residue of your structure, the bigger and redder the dot, the more strained is the residue’s backbone (unfavourable). In our case, we can see that relaxing the model removed most unfavourable conformations but not all:
Unrelaxed structure
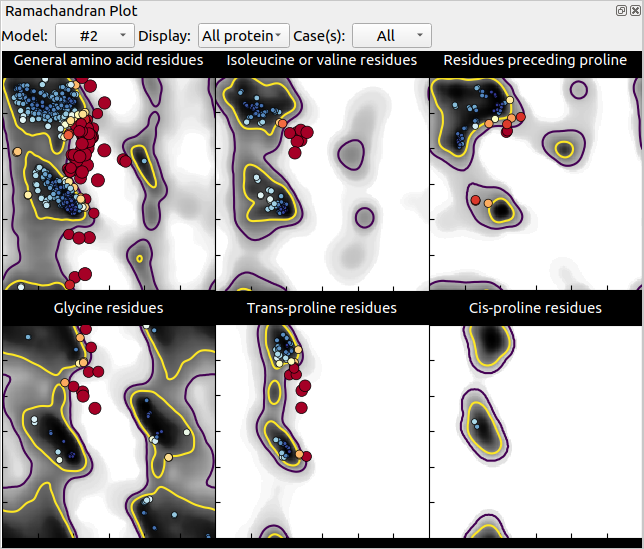
Relaxed structure
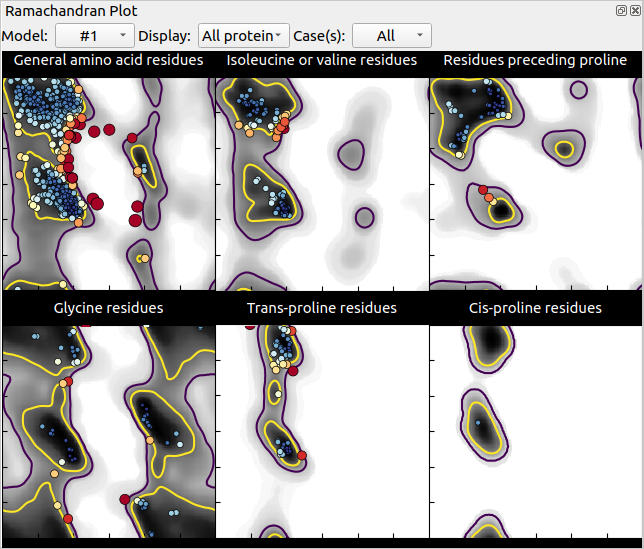
The above course material is under CC-BY-SA license.