Learning how to manipulate and visualise protein structures

Demo Step 6: Model validation with AlphaFold scores
If you’re dealing with AlphaFold predicted models, you will also be able to assess the quality of the prediction with the help of the scores that it outputs.
Local scores
There are two local scores that you can visualise in ChimeraX:
- pLDDT (Predicted Local Distance Difference Test): a pre-residue confidence score between 0 (bad) and 100 (good) pLDDT estimates whether the predicted residue has a plausible local environment. As a guide, >90 indicates a high confidence, <50 a low confidence.
- PAE (Predicted Aligned Error): a pairwise distance error estimate between 0 (good) and 31.75 Å (bad) Consider two residues x and y separated by a distance (D) in your structure and the PAE score between x and y (E), the distance between x and y can be interpreted as D ± E. The larger the value of E, the less confident we are that the predicted distance between two residues is correct. The PAE enables to assess the confidence in the domain packing and large-scale topology of the protein(s).
The first step is to upload the correct score file:
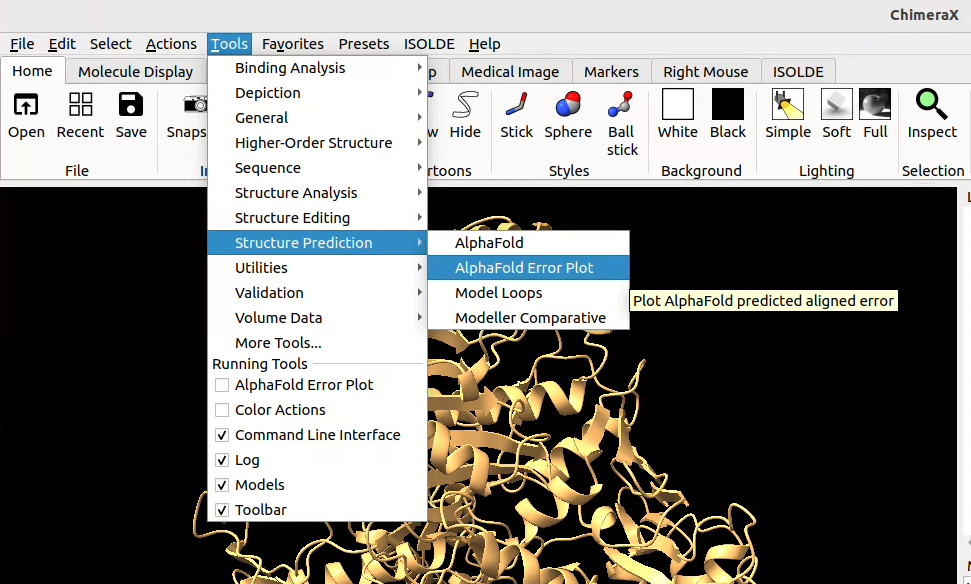
![]() click on Tools > Structure Prediction > AlphaFold Error Plot, then select your model and browse to upload the corresponding score file (json format).
click on Tools > Structure Prediction > AlphaFold Error Plot, then select your model and browse to upload the corresponding score file (json format).
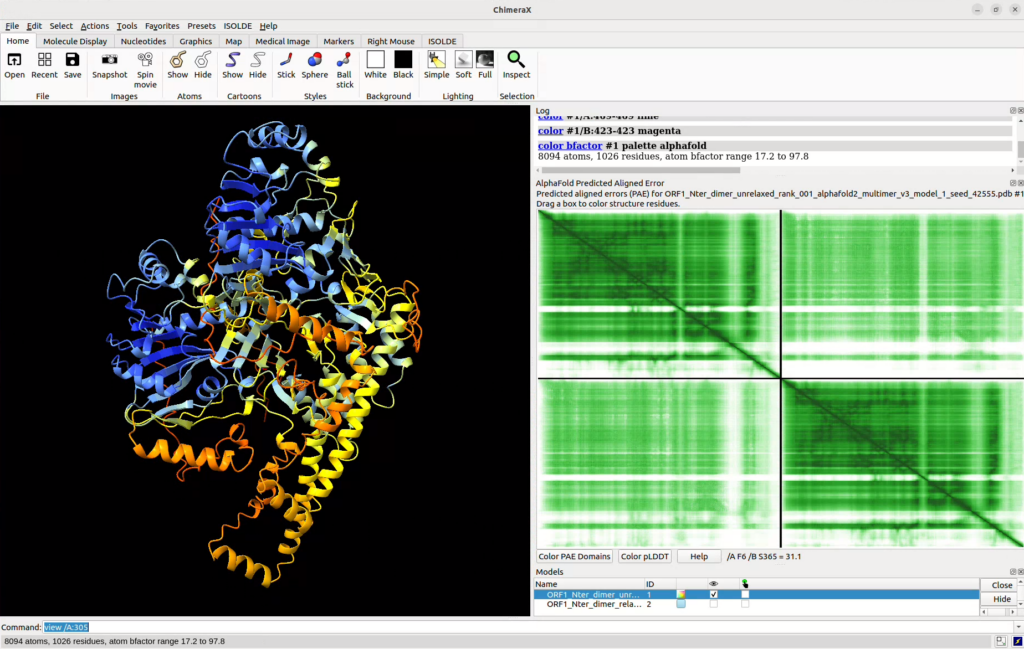
This will open up an additional pane in Chimera harbouring the PAE matrix (x and y axes correspond to the position in the protein from N-ter to C-ter, the vertical and horizontal lines are separations between different chains).
- To change the colour code of the PAE plot to a scale of green, click right on the plot and select “Color plot green”.
- To colour the structure by pLDDT confidence metric, click on the “Color pLDDT” button at the bottom of the pane.
- You can also detect domains based on the PAE plot and colour them on your structure by clicking on “Color PAE Domains”.
- If you highlight a zone on the PAE plot, it’ll select the corresponding zone in your structure.


![]() in-line you can use the alphafold pae command to open up the PAE pane, for example:
in-line you can use the alphafold pae command to open up the PAE pane, for example:
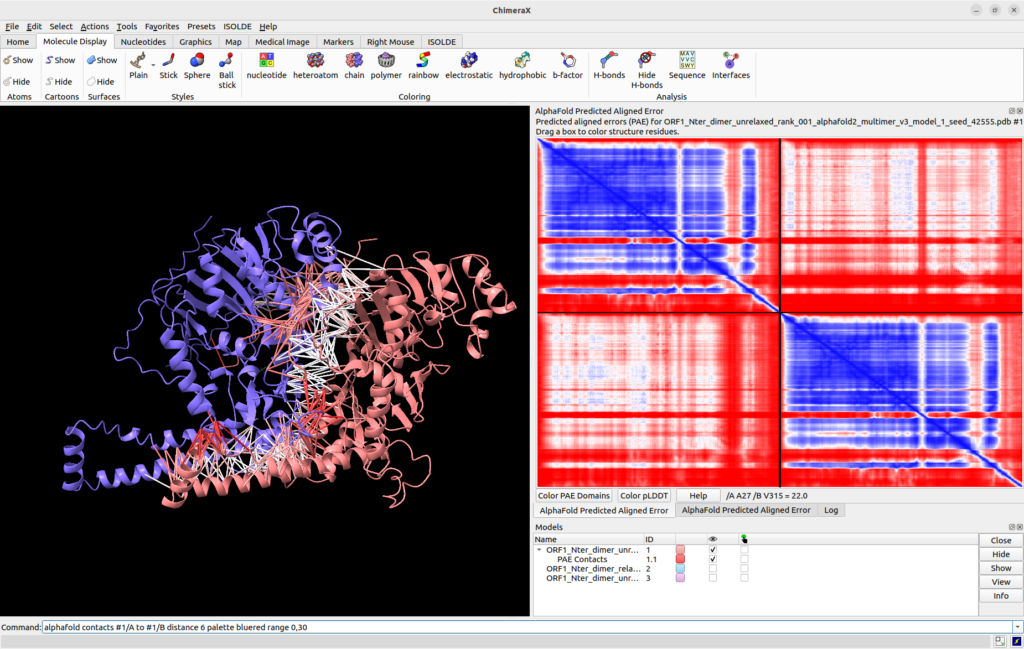
alphafold pae #1 file /path/to/your/pae.json palette bluered
will open the file you specified and link it with model #1. Additionnaly, you can specify options such as the colour palette of the plot (here, we want it to be the same as the one in the default output of AlphaFold: blue to red).
![]() Click here for more information on the alphafold command line options.
Click here for more information on the alphafold command line options.
These commands will do the same as the graphical ones (using the mouse and Tool bar) described above, but there are other interesting features that you can try out with the command line, such as plotting the PAE scores on your structures using coloured pseudo-bonds:
![]() in-line you can use the alphafold contacts command to plot the PAE scores directly onto your structure, for example:
in-line you can use the alphafold contacts command to plot the PAE scores directly onto your structure, for example:
alphafold contacts #1/A to #1/B distance 6 palette bluered range 0,30
will plot the PAE values as pseudo-bonds between residues of chain A and residues of chain B in model #1 restricted to those with a maximum distance of 6 Å. Colours will correspond to those in the PAE plot (bluered palette for scores going from 0 to 30). More information can be found on the same help page as the alphafold pae command above.

Global scores
There are several global scores returned by AlphaFold that you can use to evaluate your model:
average pLDDT: average per-residue confidence score over the whole structure
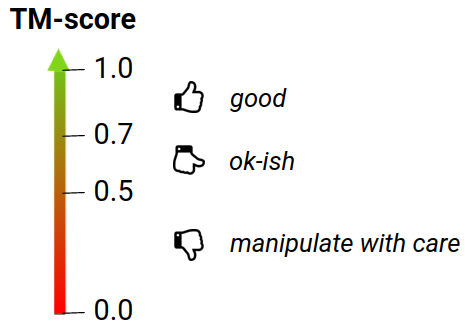
pTM-score: predicted TM-score estimated from the PAE, between 0 and 1. It mimics the existing TM-score metric used to compare 2 structures but in this case it predicts this score between the model and its hypothetical true structure
ipTM-score: pTM-score at the interface only (all interfaces are combined when there are several)
combined pTM-score: 20%pTM-score + 80%ipTM-score (Evans et al., 2021)

The above course material is under CC-BY-SA license.